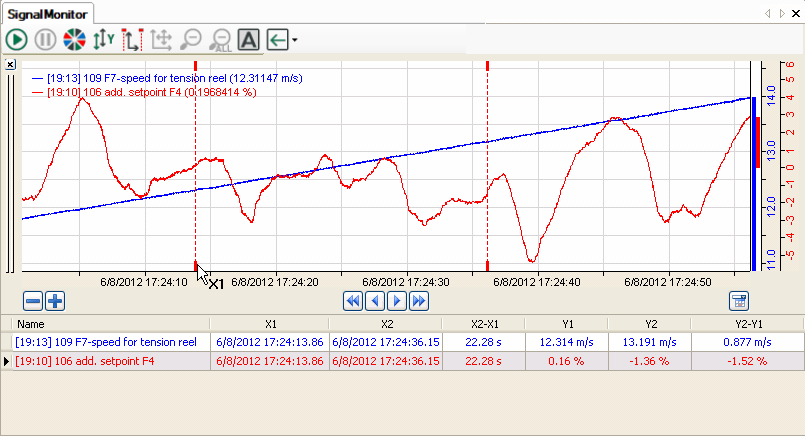
In pause mode, there are two markers, i.e. X1 and X2, available in the graph. You can move the markers individually in order to check the Y values and differences between the X and Y values of the markers.
There are two modes to control the position of the markers. The markers can be anchored to the X axis or not. These settings can be changed in the trend graph properties.
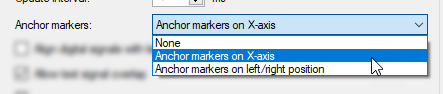
If the Anchor markers option is disabled (None), the markers will remain at the same pixel while moving the X-axis and are positioned on a new time stamp, e. g. when dragging or panning.
If the option is enabled (default: Anchor markers on X-axis), the markers will remain at the same time stamp. So, if the X axis is moved, the markers will also move. If the X axis is moved so far that the time stamp of the marker is no longer visible, the marker will be moved to the edge of the graph and the grab handles will become lighter. The table still shows the correct position of the marker. You can drag the marker from the edge of the graph back into the current X axis range at any time.
If the option Anchor markers on left/right position is enabled, then X1 will be positioned at the left end and X2 at the right end. Hence, the entire visible trend is always between the markers.