The signal table can be found at the bottom of the view. It displays the ID and name of each signal that has been added to the view.
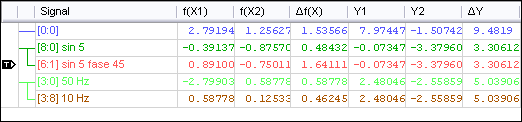
To the left beside the signal name column, there are two more permanent columns: The trigger column and the axis column. The trigger column shows which signal is currently being used as trigger signal. You can change the trigger signal by dragging the trigger icon onto another row. The second column visualizes a small list for every value axis in the view distinguished by different colors. Each list item connects the signals contained with the axis it represents. If the base markers are visible and the base axis is in time mode (X-T), the table shows the f (X1), f (X2) and ∆f (X) columns. If the base axis is in "Value" mode (X-Y), the grid shows the X1, X2 and ∆X columns.
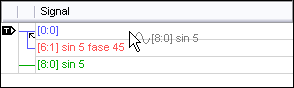
If the value markers are visible, Y1, Y2 and ∆Y are shown. You can click inside the "Name" column to shift a signal to another axis. If the signal being dragged is the only one on its axis, this axis will be removed. In order to remove a signal from an axis, drag it to any position, but not into another column. The signal is put on a new axis and added to the bottom of the signal table. In the figure below, the signal [8:0] is added between [0:0] and [6:1] of the blue axis.
The signal table's height can be adjusted. When moving the mouse to the top of the table, a resize icon appears. To auto-size the table, double-click if the resize icon is visible.