Signals can be shifted between the graphs and even beyond the limits of the window. This means that a signal can be dragged from one graph to another graph that already has a signal.
Here is how it works:
-
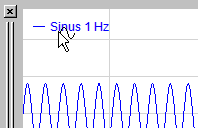
In the graph, put the mouse pointer on the signal name to be moved. The cursor indicates with a wavy line that it has acquired the signal.
-
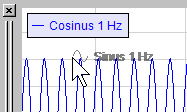
Now press the mouse key, hold it and drag the signal into the other graph and let it drop in a free area.
-
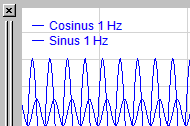
The result: two signals, each with its own Y-axis.
-
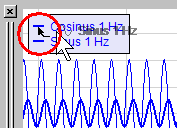
If, in step 2, the signal is not dropped, but dragged on the already existing signal (cursor shows a little arrow), the shifted signal will be assigned to the same Y axis.
-
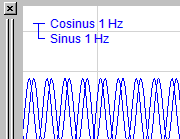
The result: two signals with a common Y axis.
-
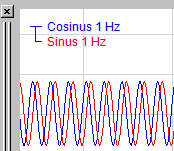
By shifting a signal from one graph to the other, the color will not change automatically. In order to get different colors, click on the “Auto color assignment”
 toolbar button.
-
If you want to separate signals, just click on the corresponding signal in the legend and drag it into the free area of the display window's X axis. A new graph is opened with that signal.