All of the axes on the view can be panned by dragging them with the mouse. You can also perform an axis center zoom (in and out) by scrolling the mouse as soon as the cursor is placed over the axis. If the scaling mode is set to manual, you can auto scale the axis by clicking the center mouse button.
The base axis can operate in two modes:
-
time mode (X-T)
-
value mode (X-Y)
In time mode, you can choose to center the axis values around the trigger or to use absolute time values.
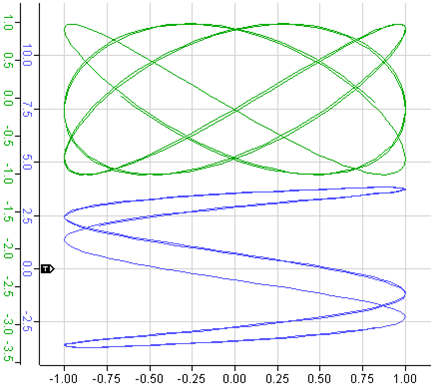
Value mode requires a signal to be configured in the properties dialog. The base axis then uses the signal values and thus becomes a value axis instead of a time axis. The signal will not be added to the signal grid. The following figure shows a base axis in value mode.
Interacting with the base axis in time mode changes the visible memory length (overview also changes). In value mode, the visible part of the memory length can only be changed by using the overview or by opening the properties dialog.
Note that the axis containing the trigger signal is always placed next to the chart.