Toolbar
The tool bar of the time periods table contains the following control elements:
|
Starts the live display of the time periods. |
|
|
Stops the live display of the time periods (pause). It is now possible to mark individual lines in the table. |
|
 |
Drop-down list for selection of time period query. If you open the drop-down list you can see all available queries and select the one you want. A mouse click on the button <Edit queries> opens the editor for creating time period queries. |
|
Carries out the SQL-query which has been selected in the drop-down list. If the query takes some time, a progress bar will be displayed in the status bar at the bottom of the table. Furthermore, there will be a link which you can use to abort the query in case it takes too long. |
|
|
Refreshes the display according to the executed query. |
|
|
Show/hide signal tree |
|
|
Highlights automatically the most recently added line. |
|
|
Copy the time periods which are selected in the table to the clipboard. Only possible in pause mode. |
|
|
Exports the time periods which are selected in the table to an Excel or text file. Only possible in pause mode. |
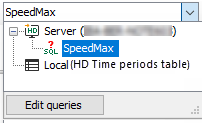
You can display time periods from different time period stores of an HD-Server in the table.
Select the time period store which should be displayed. You have the following options:
-
Open the tree by clicking the signal tree button in the toolbar and select there the time period store which should be displayed.
-
Or drag and drop the time period store out of the HD signal tree into the table.
-
Or open the properties by a right mouseclick in the time periods table and select the time period store there.
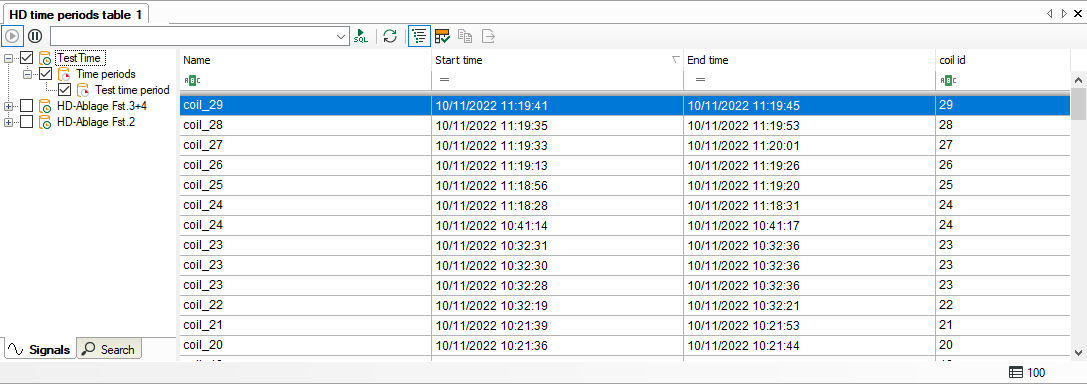
In live mode new lines will be added when new time periods are generated. The lines are updated when the end time or other info fields are updated.
Status bar
The status bar is on the lower border of the table. It gives information about the SQL-queries carried out (e.g. status of the running query, number of the events, error messages) and if a filter is currently active. Furthermore, while the query is running there will be a link which you can use to abort the query in case it takes too long.
Sorting
The table can be sorted ascending or descending by every column. Click on the header of the column which you want to use as sorting criterion. The little arrow (up or down) indicates the sorting order (descending or ascending). By default, the descending order is selected for the "Start time" column. Hence, the most recent event is always on top.
Filtering
Right below the column headers there is a filter row. You can filter the table by entering the entire name or parts of it in the input field or by choosing from available options. Press <Enter> after your entry and the table will be sorted. To return to unfiltered view, clean the filter row fields. The filter options are determined by the data type of the info fields.
For detailed information about the filter functions, please refer to Advanced filter in tables.
Show/hide columns
If you right-click on the table, you can select the visible columns or hide columns in the context menu.
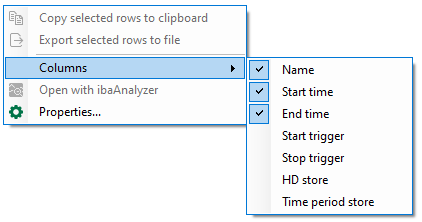
In the upper section of the context menu, you can select the standard columns, and in the lower section the columns for the info fields. The info field columns that appear in the context menu can be configured in the properties of the time periods table, see next section.
View a time period in ibaAnalyzer
In order to load a time period out of the table into ibaAnalyzer and open it, make a right-click on the desired row and select Open with ibaAnalyzer in the context menu. If ibaAnalyzer v8.1 or higher is installed on your system, the time period will be opened showing the info fields of the time period. Moreover, the name of the time period is applied as file name. If an older version of ibaAnalyzer is installed, then just the time range will be opened and no time period info fields will be queried.
Special features in pause mode
When the view is in pause mode you can select multiple time period rows. If you then click on Open with ibaAnalyzer in the context menu, all selected time periods are opened as separate files in ibaAnalyzer.
There are some more features available in the context menu while in pause mode:
-
Copy selected rows to clipboard: This will copy the displayed text of the selected rows to the clipboard. Columns are separated by tabs and rows are separated by new lines.
-
Export selected rows to file: This allows you to export the values of the selected rows to an Excel file (.xlsx or .xls) or a text file.
These commands can also be triggered by the last two buttons in the toolbar.