Toolbar
The toolbar of the event table contains the following control elements:
|
|
Starts live alarm stream. |
|
Starts the live display of the event table. All triggered live events are immediately displayed in the event table. |
|
|
Stops the live display of the event table. It is now possible to mark individual signals in the event table. |
|
|
Displays the number of events in a time range. Select the events of the event table and the time range in the dialog window. The table that appears contains a list with the number of events. |
|
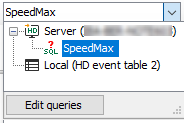 |
Selection list for selecting the desired event query. If you expand the list field, you can see all existing event queries and select the one you want. If you click on the <Edit queries> button, the configuration dialog for queries opens. You can then edit existing queries or create new ones. |
|
|
Executes the event query that was selected in the selection list. |
|
Updates the display according to the query executed. |
|
|
Automatic acknowledgement of all incoming events |
|
|
Display/hide signal tree |
|
|
Automatically marks the last line added. |
|
|
|
Copies the line(s) selected in the event list to the clipboard. Only possible in pause mode. |
|
Exports the line(s) selected in the event list to an Excel or text file. Only possible in pause mode. |
|
|
|
Acknowledges all events displayed in the event table. |
Add and query signals
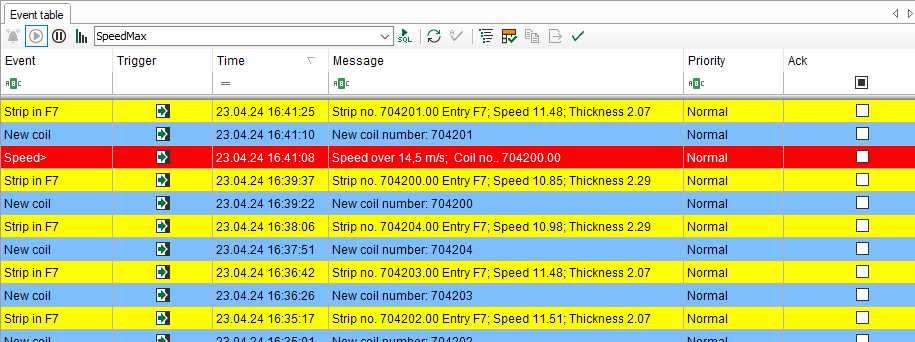
All events configured in the HD event-based data storage and enabled for display appear in the table at the time of their occurrence (trigger). An event can be added from the HD signal tree either by:
-
drag and drop from the signal tree into the event table or
-
enabling the corresponding checkbox in the properties of the event table. To open the properties, right-click on the event table and chose Properties.
In order to search for historic occurrences of events, you can edit queries.
Other documentation |
|
|---|---|
|
For more information about configuration of event queries, please refer to the ibaHD-Server manual. |
|
After a query had been executed, the event table automatically switches from live mode to pause mode. If you want to return to live mode, you have to press the corresponding button in the toolbar.
For easier control, there is a filter row with some functions below the toolbar:
-
Sorting by mouse click Click on a column header to sort the events by this column in alphabetical/numerical order. Every click on the header toggles between ascending/descending order.
-
Filtering You can filter the table by entering the entire name or parts of it in the input field or by choosing from available options. Press <Enter> after your entry and the table will be sorted. To return to unfiltered view, clean the filter row fields. The filter options are determined by the data type of the event fields.
For detailed information about the filter functions, please refer to Advanced filter in tables.
Tip |
|
|---|---|
|
If you double-click an event in the list, the HD trend graph will jump to the time of the event and enter Pause mode. |
|
Special features in pause mode
When the view is in pause mode you can select multiple rows. If you then open the context menu with a right-click, you have more features available:
-
Copy selected rows to clipboard: This will copy the displayed text of the selected rows to the clipboard. Columns are separated by tabs and rows are separated by new lines.
-
Export selected rows to file: This allows you to export the values of the selected rows to an Excel file (.xlsx or .xls) or a text file.