You can open a context menu by right-clicking in the area of a trend graph.
The context menu provides further control options for the view and may look as follows:
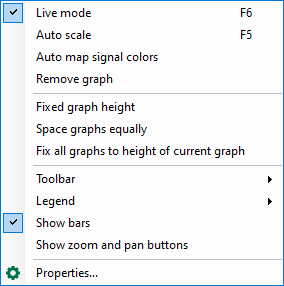
Some menu commands correspond to the functions of the toolbar buttons as described above, like Live mode/Pause, Auto scale and Auto map signal colors. However, the first 4 commands from top only apply to the trend graph the context menu was opened in.
Fixed graph height
In order to avoid up or downsizing of a trend graph while resizing the view window, you can fix the height of the signal chart individually. When enabling this option, the current height of the signal chart is maintained.
In case of resizing a window vertically, all charts are subject to resizing except for the signal charts, whose heights are defined by this option. If this option is enabled for all signal charts of a view, the minimum height of the display window will always comply with the overall height of all graphs.
Space graphs equally
If you click this command, all charts in the view lose their fixed heights and are automatically scaled to fit equally in the view window.
In the next block of the context menu, you can display or hide the indicating elements of a signal monitor:
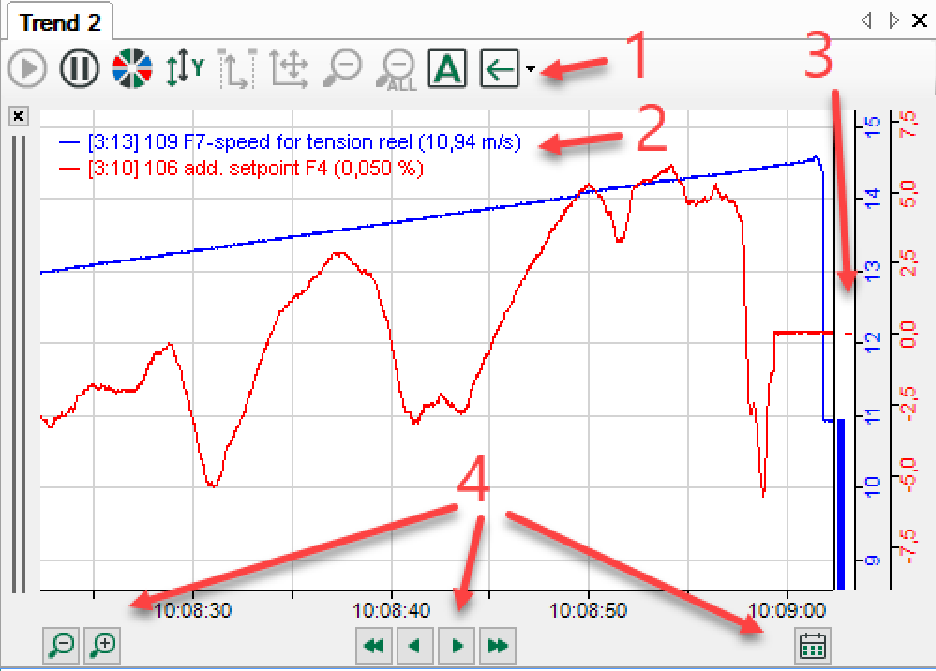
Show toolbar (1)
Show or hide the toolbar of the view where the context menu was opened. In the sub-menu you can hide either the entire toolbar or single buttons.
Show signal values in legend (2)
Show or hide the signal values at the end of the signal legend. Another option is to choose a customized legend text (which is to be configured in the properties). This command applies to all trend graphs within the view where the context menu was opened.
Show bars (3)
Show or hide the value bars along the Y axes. This commend applies to all trend graphs within the view where the context menu was opened.
Show zoom and pan buttons (4)
Show or hide the zoom and pan buttons on the X axis of the view where the context menu was opened.
For more information on controlling zoom and pan buttons, please refer to X-axis buttons.
Properties…
If you click on this command, you will enter the Properties dialog for setting up of the trend graph view.
For more information, see Properties and preferences trend graph.