This description only applies to trend graphs.
Bar charts on the Y axis are another option of signal display.
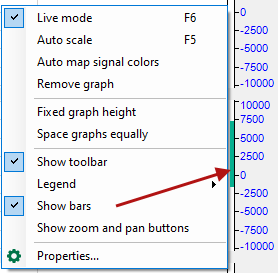
You can enable the bar graph display either by using the context menu by clicking in the trend graph and select "Show bars", or in the "Properties" dialog Trend graph – Show bars.