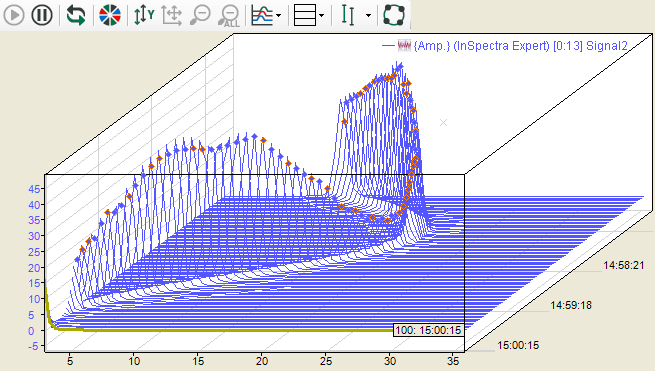
The main window of the FFT view can be converted to an isometric perspective. In this mode, the successive FFT events of a spectrum are displayed on a Z-axis, with the newest result closest to the axes origin, in order to create a waterfall effect. The display is restricted in ibaPDA to 262144 data points, in ibaAnalyzer configurable via memory usage per FFT. However, note that using a waterfall display requires more resources than a single spectrum.
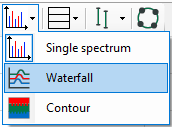
You can switch to the waterfall perspective via the corresponding button in the toolbar of the FFT view.
Alternatively, you can switch perspectives in the properties dialog of the FFT view as well.
In the above figure, you can see the results of the last 100 calculations and it is clearly visible how the spectrum changed in the course of time.
By using the <Up> and <Down> cursor keys or by scrolling with the mouse wheel, you can move through the planes and have displayed the related spectra and parameters.
When moving the mouse with the <Ctrl> key pressed, you can change the angle and perspective of the view. If you press the <Shift> key at the same time, then the display pans to 0 degrees. The axis position settings are overwritten in this mode.
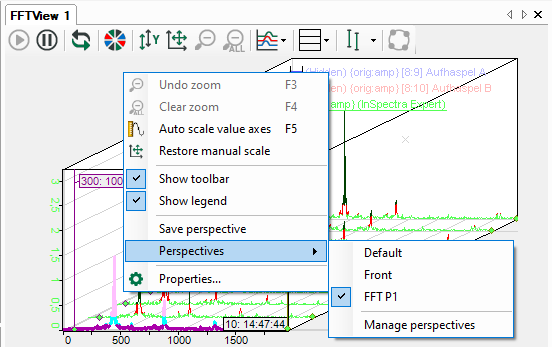
If you have set the desired perspective, you can save it. To do this, select Save perspective in the context menu and enter a name. Saved perspectives also appear in the context menu and can be re-enabled at any time. When you select Front perspective, the display pans to 0 degrees. Selecting Default returns you to the default setting. See also chapter Properties and preferences FFT view
It is possible to apply the contour color scheme to the waterfall view. The amplitude range is split up in a configurable number of bands to which a color is assigned. This allows the amplitude level to be represented by colors. Up to 50 different colors bands are supported.
Scales are always displayed at the side of the chart not overlapping with the perspective flow direction. Several spectra can have different sample rates or bin values and thus the clock in which the FFT results are available may vary. That is why it is pre-set that every spectrum moves on the Z-axis at its own pace.
However, there is the option to synchronize the Z-planes across several spectra. With this option enabled, the FFT view will not allow a spectrum to advance over the Z planes until all spectra have generated a new FFT result. While the view is waiting for certain spectra to generate results, the other spectra keep showing their newest results on the front plane.
While the waterfall perspective is enabled, the label, marker and zoom rectangle functionality is limited to the foremost plane.
The sorting of the levels is configurable, i.e. you can specify which level is displayed at the front. You can choose between chronological sorting and sorting according to a signal value. The distance between the planes then depends on the time difference or the signal value difference between the planes.
The appearance options of the waterfall display is determined in the properties window in the node Z-axis. See chapter Z-axis.


