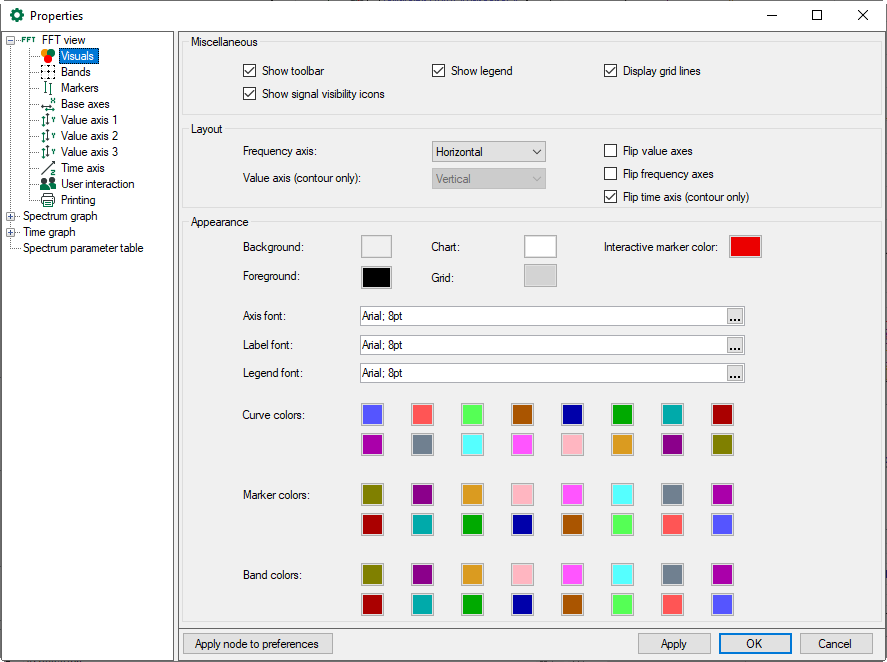
In the dialog of the Visuals node, you can set the appearance and colors of the FFT view.
Miscellaneous
You can set whether the toolbar, legend and grid lines are displayed or not.
If you have checked the "Show signal visibility icons" option, you can hide and show the signal by clicking the eye icon in the signal legend.
Layout
You can change the alignment of the FFT axes from horizontal to vertical or vice versa by selecting the relevant option from the picklist Frequency axis. You can also flip the individual axes.
For a contour view, the color axis (value axsis) can be displayed horizontally or vertically next to it.
Appearance
Here you make the settings for colors and fonts. For the coloring of curves, markers and bands, 16 colors are available, which are automatically assigned to the corresponding items one after the other when they are added in the view.

