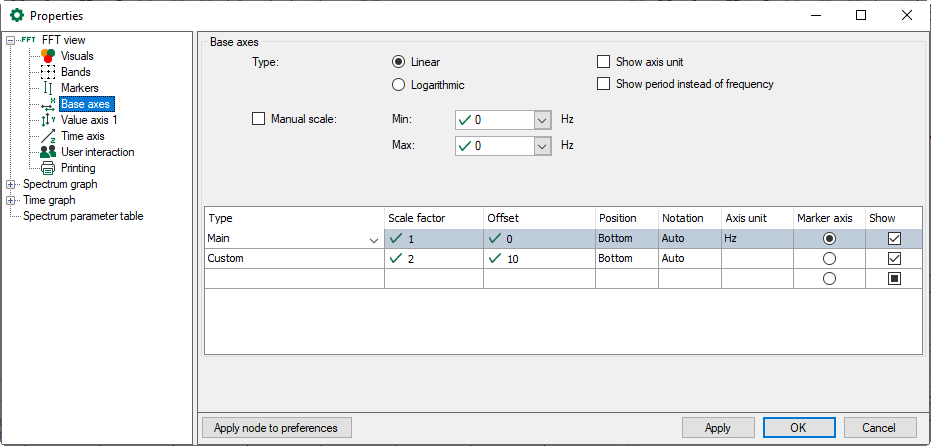
You can choose between linear and logarithmic display here and whether the axis unit is displayed or not. Typically, the base axis has the unit Hz in the frequency domain and seconds in the time domain.
The base axis can be inverted so that, for example, the vibration duration (T) is shown instead of frequency (f). The following applies here: T = 1/f.
If Cepstrum is set as the spectrum method in the InSpectra profile, a Millstrum can be displayed for the base axis instead of period or frequency.
Properties
The figure above shows the properties of the base axes in the FFT view. By default, the scaling values are automatically determined. However, you can also make a manual specification.
In case of using a manual scale, beside static values you have the possibility to use a signal for determination of beginning and end values of the scale (min, max). Therefore, just click on the arrow in the Min or Max field and select the appropriate signal in the signal tree.
By default, the table of axes only shows the default Hz axis or order axis with optional setting options for the position (top/bottom), notation (auto/standard/scientific), and axis unit. To change these settings, click on the corresponding cell and select them from the drop-down list.
If you have defined several base axes, select which base axis the markers in the display should refer to in the Marker Axis column.
Use the Show option to control whether the base axis is displayed or not.
You can add and configure other base axes as needed. These additional base axes can have a different scale, reference value or unit.
An offset can be configured for a custom X-axis. It is also possible to configure a dynamic offset i.e., an offset depending on a signal value.
By default, the basic display settings for the base axes are adopted from the main window and from the spectrum graph. You can then either change some display settings for the base axes for the frequency spectrum display or synchronize them again with those from the main window.
Note |
|
|---|---|
|
The manual “Minimum” and “Maximum” scale settings always apply only to the main axis (Hz). All other base axes enabled in the FFT view are scaled automatically. |
|
Each axis to be shown in the graph is represented by a line in the table below.
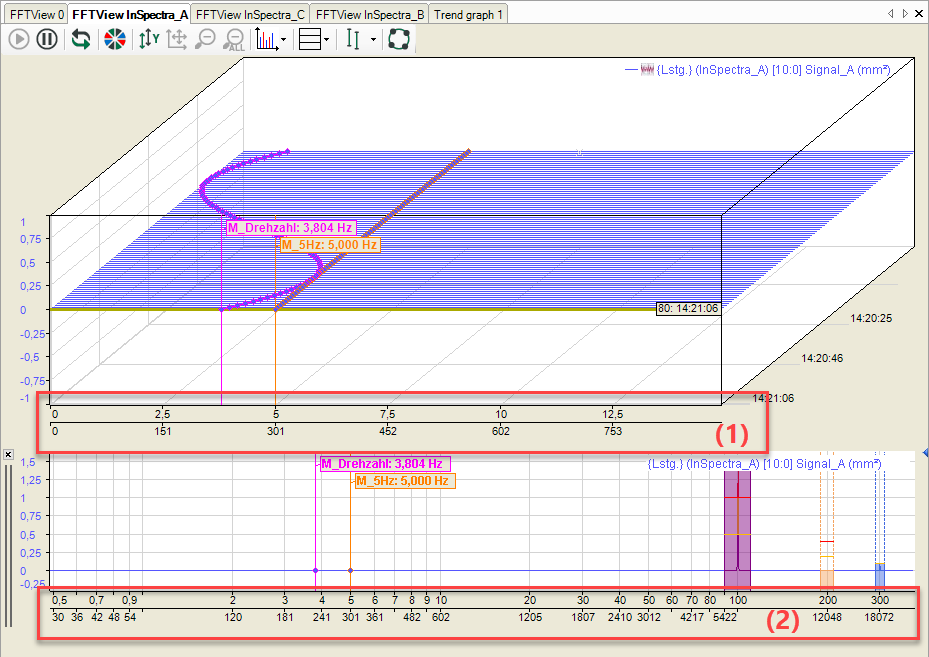
In the following example, two base axes were defined. The first shows the frequency in Hz and the second in rpm. The base axes in the main window (1) are linear. The base axes in the display frequency spectrum (2) are logarithmic.
In addition, the main window was zoomed in.
Note |
|
|---|---|
|
Axis = 1/scaling factor |
|

