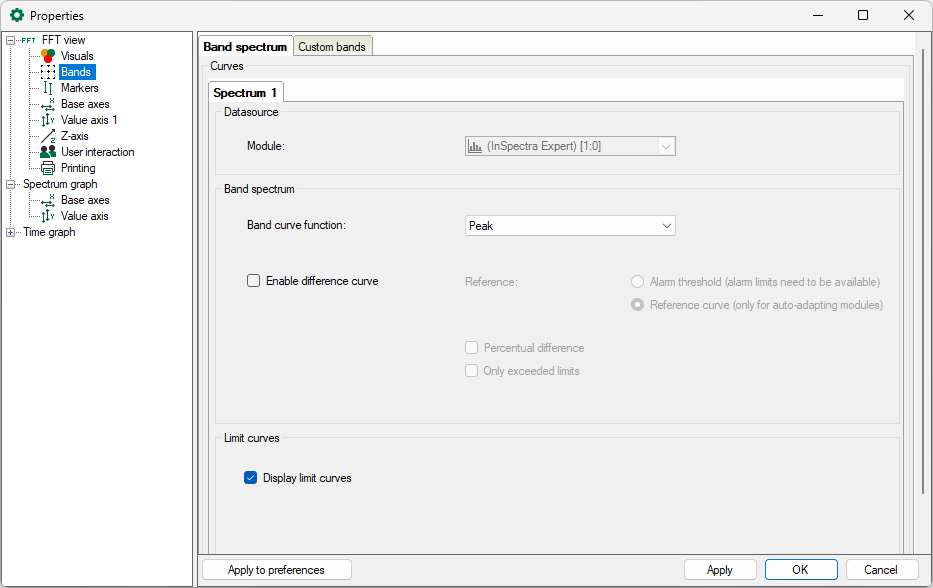
The spectra of the individual bands can be displayed in the Band spectrum mode.
Data source
Display of the module
Settings
You can select the displayed curve function in the Band curve function drop-down menu:
-
Peak, Peak fequency, RMS
Enable difference curve
If the FFT view shows an auto-adapting module, a difference spectrum can be displayed representing the difference between the reference curve or the alarm thresholds for each band.
The Percentual difference shows all values in percent to the reference values. If Only exceeded limits is enabled, the Y-value is set to 0 for all bands in which the limit is not exceeded.
Display limit curves
Enable this option to show the limit curves in the FFT view. A limit curve interconnects all band limits of the same type (warning, alarm, lower or upper).
