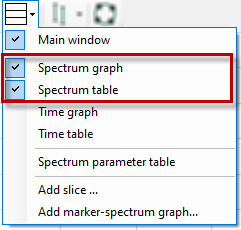
In addition to the main window, you can open a graphical and/or tabular display of the data of the frequency spectrum. Click on the button for the window menu in the toolbar of the FFT view for this purpose.
Graphical display and data table form one group, as the table always provides the data matching the spectrum in the graph. However, the graph and table can be individually displayed or hidden.
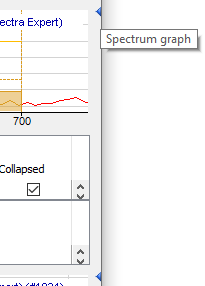
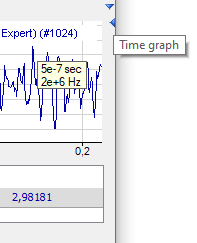
In addition, the graph and data table can be minimized (see following figure right side) or displayed together (see following figure left side). To do this, simply click on the small triangle on the right margin of the display:
Note |
|
|---|---|
|
Without InSpectra modules, the spectrum graph shows the same information as the individual spectrum in the main window and the table does not contain any data. |
|
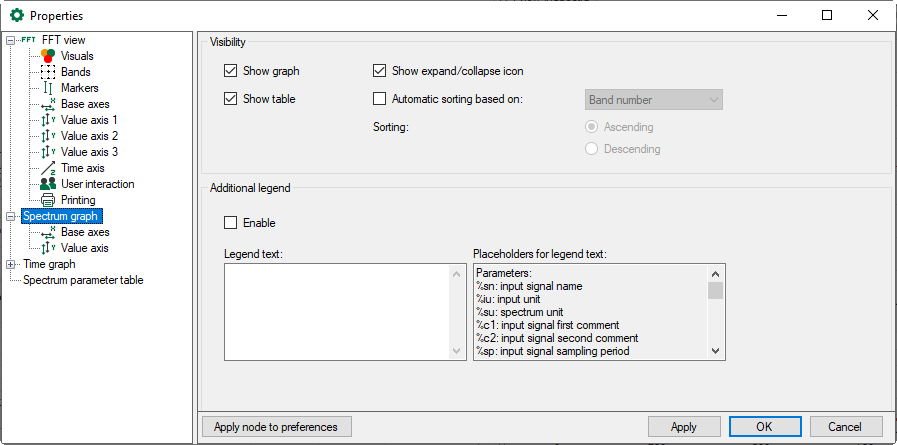
You define general display properties in the properties dialog of the FFT view in node Spectrum graph.
Visibility
You can define here whether the graph and the data table for the spectrum graph are shown by default. Even if a view is disabled here, it can be re-enabled later in the FFT view toolbar.
You can also specify whether the small triangles for expanding and collapsing the graph and data table should be displayed.
The data table can be sorted automatically. Define the parameter (column) here according to which and in which sequence the table is sorted.
Additional legend
When this option is enabled, another legend is displayed in the spectrum graph window in addition to the normal signal legend. You can define the content of this legend yourself. For example, you can enter a detailed multi-line text, in which placeholders for dynamic information can also be used. The following placeholders are available:
-
%sn: Input signal name
-
%iu: Input unit
-
%su: Spectrum unit
-
%c1: Input signal first comment
-
%c2: Input signal second comment
-
%sp: Input signal sampling time
-
%x: X-value at interactive marker
-
%y: Y-value at interactive marker
-
%xmouse: X-value at mouse cursor
-
%ymouse: Y-value at mouse cursor
-
%tmouse: Z-value at mouse cursor
-
%xmv: X-value of the nearby marker position
-
%ymv: Y-value of the nearby marker position
-
%tmv: Time value of the nearby marker position
-
%nmv: Name of the nearby marker position
-
%imn: InSpectra Expert module name
-
%n: Band name
-
%nb: Band number
-
%r: RMS value
-
%p: Peak value
-
%pf: Peak frequency
-
%c: Center frequency
-
%d: Delta frequency
-
%l: Lower frequency
-
%ats: Alert status text
-
%ams: Alarm status text
-
%events: Alert & alarm status text
-
%atrmsl: Limit value for RMS alert
-
%atpeakl: Limit value for peak alert
-
%amrmsl: Limit value for RMS alarm
-
%ampeakl: Limit value for peak alarm
-
%atrmspc: Quota of limit value for RMS alert
-
%atpeakpc: Quota of limit value for peak alert
-
%amrmspc: Quota of limit value for RMS alarm
-
%ampeakpc: Quota of limit value for peak alarm
-
%v: the monitored value
-
%mtype: monitored type: either "rms" or "peak"
-
%etype: Event type: either “alert” or “alarm”
-
%s: Event status text
-
%lim: Limit value of the event
-
%pc: Quota of event
By default, all signal-related placeholders are determined based on the first spectrum. To identify another spectrum, use a colon followed by the word “spectrum” and the index of the spectrum, e.g. "%sn:spectrum1", in order to refer to the first spectrum.
Band-related placeholders can be referred to by the band name (e.g. "%p:bandname") or by the band number (e.g. "%p:band0").
Event-related placeholders can be referred to as follows:
-
%lim:band0:atpeak (Peak alert)
-
%lim:band0:ampeak (Peak alarm)
-
%lim:band0:atrms (RMS alert)
-
%lim:band0:amrms (RMS alarm)
You may use as well the event name instead of “atpeak”, “ampeak” etc.
Use the optional formatting string “w.p” to specify the format of the numeric parameters, where “w” is the width and “p” is the precision. The width is the minimum number of the characters shown. Precision is the number of decimal places.
Example: "%5.3y1" indicates the Y-value for marker X1 with a width of 5 characters and a precision of 3.
You can combine most of these techniques:
E.g. "%10.5p:spectrum1:someband" E.g. "%.6pc:spectrum2:otherband:eventname"


