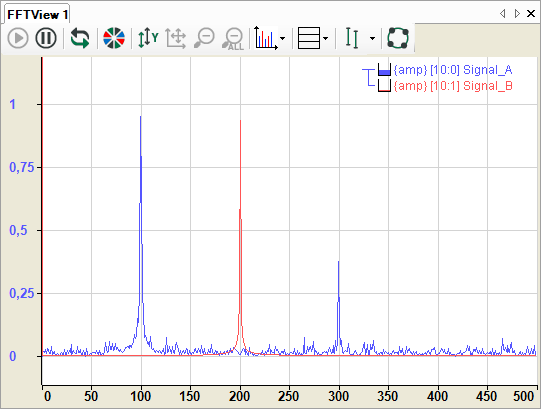
In the main window, the result of the FFT of the signal to be examined is shown in the frequency domain. The standard view for the main window is the individual spectrum.
You can enable an interactive marker that you want to use to read frequency values and the associated amplitudes along the X-axis.
When switching to the waterfall or contour view, the individual results of the frequency analysis are displayed spatially offset. This provides an overview of the history of the frequency response curve.
Detailed information can be found in chapter Waterfall.
