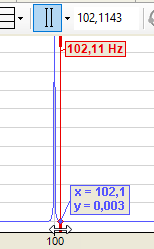
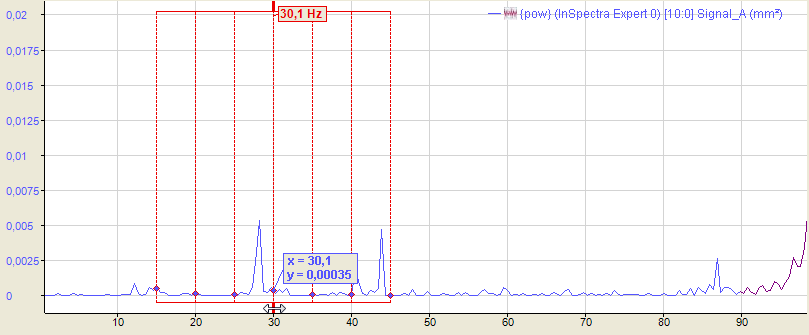
The interactive marker is used for spontaneous reading of X and Y values in a spectrum display. It can be shown or hidden at any time.
When activating for the first time, the marker is displayed at the position 1 Hz. Every time the marker is switched off and on again, it memorizes the last position.
You can change the marker position either by clicking on the thick ends at the top or at the bottom of the marker or by using the cursor keys:
|
Keys |
Function |
|---|---|
|
<Cursor to the left>/<cursor to the right> |
Normal step width |
|
<Shift>+<cursor to the left>/<cursor to the right> |
Large steps |
|
<Ctrl>+<cursor to the left>/<cursor to the right> |
Small steps |
When you move the mouse over the thickened end of the marker, the cursor changes to a double-arrow symbol. You can then move the marker. In the label with the marker color (default: red), the X value is displayed on the base axis. If there are several base axes, you must specify in the settings of the base axes which axis the marker should refer to (Marker Axis). In addition, X and Y values are displayed at the intersection of the marker with the spectrum.
Center markers
Since the marker has a certain position on the frequency axis, it is possible that it is not visible in the image anymore after zooming. Switching the marker off and on to bring it back into the image is useless, as it does not change its position because of that.
This is what the Center Marker function is for. With this function, you place the marker in the center of the section currently visible.
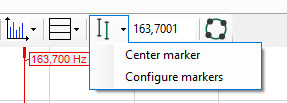
Click on the arrow symbol at the marker button in the tool bar and then on "Center marker."
Configure marker
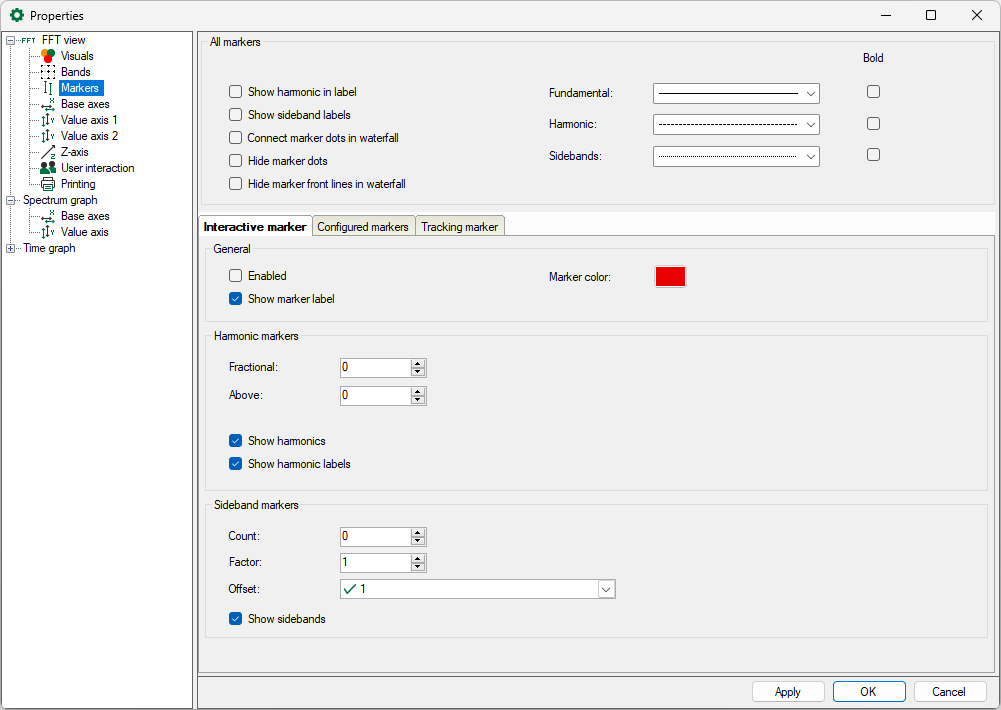
In addition to general properties such as color and label, you can also configure harmonic markers and sideband markers in the settings.
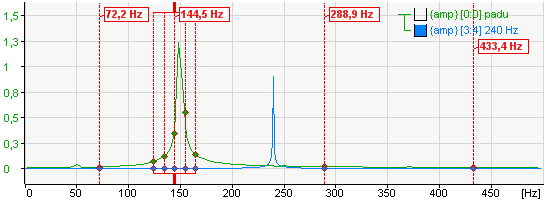
Harmonic markers always have a frequency that corresponds to an integer multiple of the main marker. For the harmonic markers, determine the requested number of the harmonic components below and above the current marker frequency. For the harmonic frequencies, further lines are displayed. Additionally, in the Markers branch, enable the option Show harmonic in label to display the frequency values on the markers.
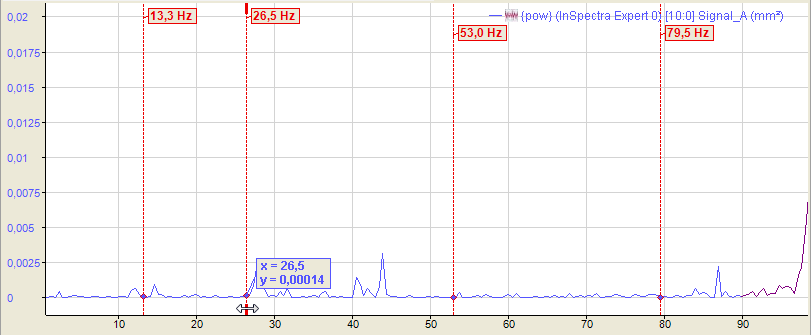
The above figure shows an interactive marker with 1 harmonic component below and 2 harmonic components above the marker frequency of 26.5 Hz.
The values of the harmonic markers are displayed at the maximum height of the value axis. The unit of these values corresponds to the unit of the base axis (see the chapter Base axes). The view can be configured to show only the frequency of the main marker.
An adjustable number of sideband markers is added symmetrically right and left of the main marker. The distance to the main marker and the neighboring sidebands is the sideband offset, represented in units of the base axis. The sideband offset can be a constant value or an analog signal. The offset can also be changed with the mouse by touching one of the outer markers with the cursor and moving it to the left or right with the mouse button pressed down.
You can enter a factor if the sideband marker is to be at a multiple or fraction of the marker frequency. When the position of the marker in the display is changed by dragging, the factor is updated.
The above figure shows an interactive marker with 3 sidebands and offset of 3 Hz each.
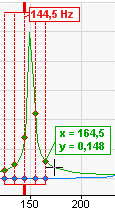
Small diamonds indicate where markers and spectra intersect. If the mouse pointer is moved near a diamond, its coordinates (X and Y values) become visible.
Harmonic component and sideband markers can be displayed in combination, too. The figure below shows a view with a harmonic marker below and two above the main marker. The sideband offset is set to 10 Hz.
Note |
|
|---|---|
|
If the sideband offset is specified by a signal, the value of this signal always has to be >=0. If the value is negative, the offset = 0 and no sideband markers are displayed. |
|
Note |
|
|---|---|
|
You can make the general settings of the markers in the preferences. You will find individual settings for the FFT views in the properties of a view. For further information, see chapter Properties and preferences FFT view |
|

