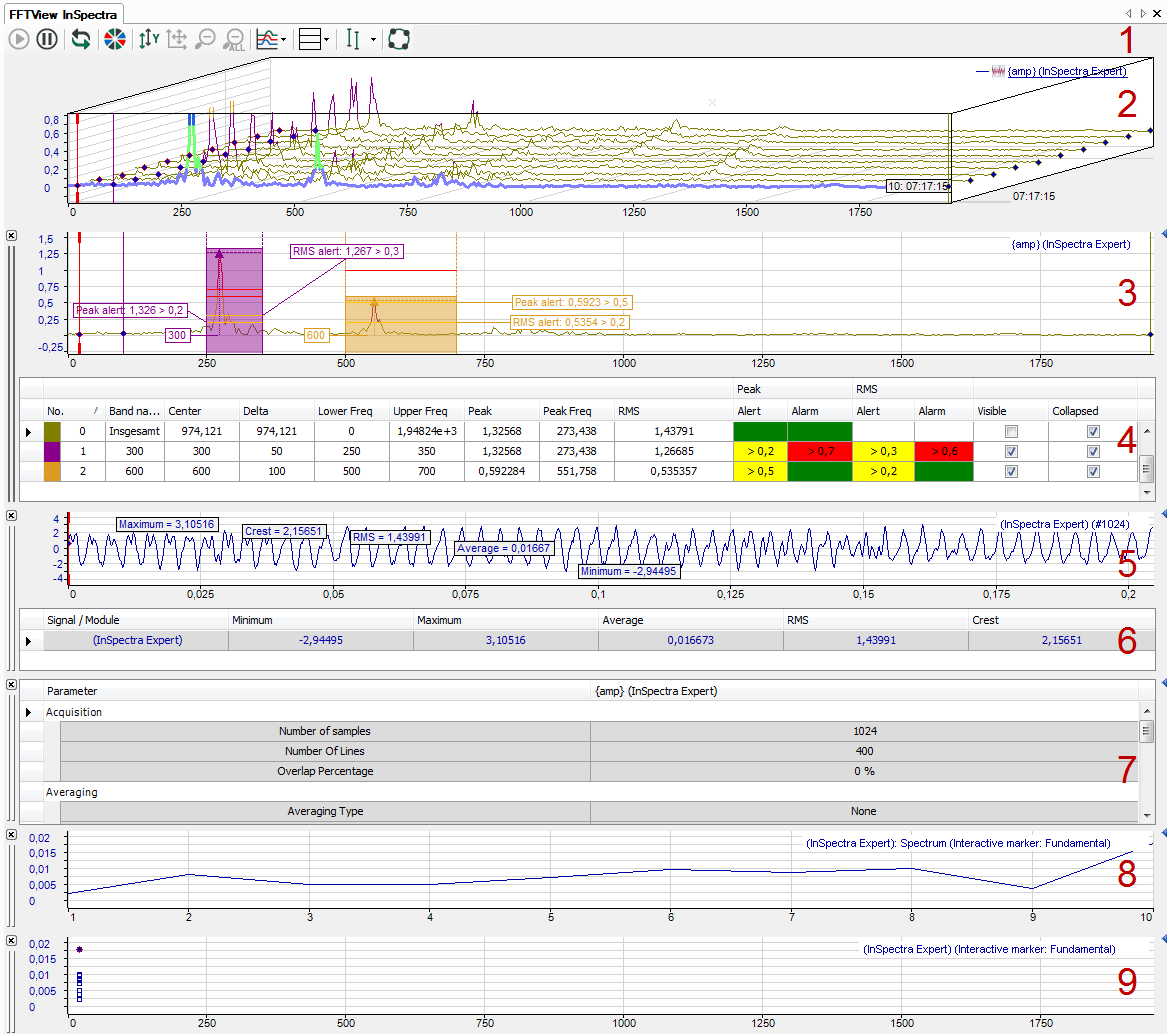
The FFT view offers a number of special graphs and tables, which can be individually displayed or hidden as needed.
Legend
|
1 |
Toolbar |
|
2 |
Main window, signal spectrum of the input signal |
|
3 |
Spectrum graph (bands, frequency domain) 1 |
|
4 |
Spectrum table (data, frequency domain) 2 |
|
5 |
Time graph (graph, time domain) |
|
6 |
Time table (table, time domain) |
|
7 |
Spectrum parameter table |
|
8 |
Slice graph3 |
|
9 |
Marker spectrum graph3 |
1 With ibaInSpectra, additional static values, warning and alarm limits
2 Can only be used with ibaInSpectra
3 Slice graphs and marker spectrum graphs can exist several times
The main window is always displayed at the top. The additional windows for graphs and data of spectrum and time domain are grouped in pairs. In analogy to normal trend views, their position can be changed at the header bar by using the mouse. You can display or hide the individual graphs and tables within the FFT view by means of the buttons as shown in the above figure.
Toolbar
|
Start FFT view / Pause FFT view (only ibaPDA) Stop or continue the FFT display update |
|
|
Reset all displayed data (only ibaPDA) The display is cleared only once and all values are set to zero until the next FFT calculation is completed. |
|
|
Determine planecount automatically (only ibaAnalyzer) |
|
|
Auto color signals |
|
|
Auto scale value axis |
|
|
Restore manual scale 1) |
|
|
Zoomout one level / Zoomout all 1) |
|
|
Toggle display type in the FFT main window (single spectrum / waterfall / contour) |
|
|
|
Open the sub menu for showing/hiding the windows Main window with/without waterfall (graph, frequency domain) Sectrum graph (graph, frequency domain) Spectrum table (table, frequency domain) Time graph (graph, time domain) Time table (table, time domain) Display spectrum parameter table Add slice ... Add marker spectrum ... |
|
Toggle interactive marker visibility, center or configure the marker If the interactive marker is visible, a value field will be displayed beside the button in the tool bar. The field shows the actual position of the marker on the X-axis (Hz). But you can also enter a value into the field to position the marker accordingly. Add InSpectra speed marker (the speed marker corresponds to the speed signal configured in the module) No function for configured markers |
|
|
Switch to the order spectrum (if speed signal and parameters of the order calculation are configured) |
|
|
1) Individually affects the main window, spectrum or time graph, depending on the focus |

