In the time graph, the time curve of the input signal is graphically displayed. The displayed section contains exactly the samples of the input signal which were included in the FFT calculation.
If the averaging function was enabled in the calculation settings of the profile, then the display shows the time signal of the last internal FFT calculation. The displays of the FFT results in the main window and frequency range, however, are also based on prior values of the input signal.
Basically the input signal of the InSpectra module is displayed. However, you can also drag further signals from the signal tree into the time graph. If there are several signals in the main window already, you can select those in the context menu of the graph.
If the time graph has the focus (after a mouse click on the header bar), the tool buttons for zooming out and restoring the manual scale relate to this graph and not to the main window. The same applies to the assigned function keys <F3>, <F4> and <F5>.
Markers
You can also enable markers via the context menu of the display (Show markers). The two markers can be moved independently of each other in the display. The legend on the right shows the time difference between the markers and the corresponding frequency.
Legend
The legend of the display contains various information:
-
Name of the InSpectra module (if present)
-
channel number of the input signal
-
Name of the input signal
-
Number of samples for the FFT, unit of the input signal
Base axis
The time graph has a base axis. When autoscaling, the length of the base axis results from the number of samples and the sampling time. You can modify the settings of the base axis in the properties of the graph.
Value axis
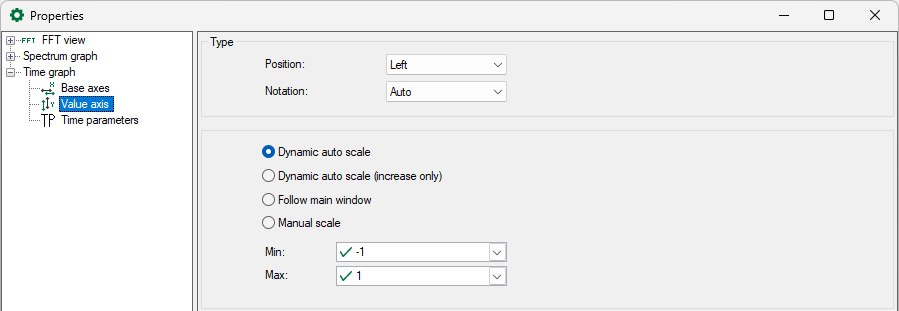
The time graph has only one value axis. All curves in the graph are displayed on the same scale of values. You can modify the settings of the value axis in the properties of the graph.
Time parameters
The statistical values (average, minimum, maximum, RMS, crest) determined for the input signal in the shown time range can be displayed in the graph. For this purpose, select the desired parameters in the properties dialog of the graph.
Note |
|
|---|---|
|
Sometimes, the crest factor and RMS value is not immediately visible in the graph, as it can be significantly higher or lower than the values of the signal curve. Change the scale of the value axis to see the crest factor. |
|


