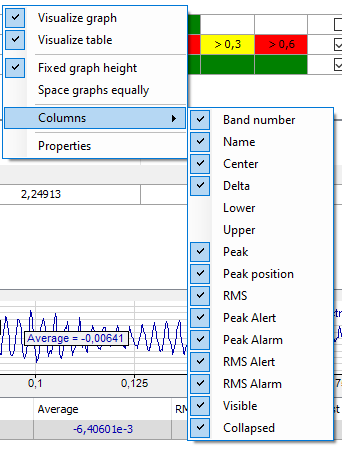
The data table for the frequency spectrum only contains data if it is an InSpectra module. In case of a simple analog signal, the table remains empty.
In the table, a line is automatically created for every defined band of the displayed InSpectra module.
The parameters and – if configured – the results are shown for each band. Results and alarms for characteristic values are displayed in the area below. A line is created for each parameter.
If there are several InSpectra modules in the spectrum graph, the table also shows the data for the bands of the other spectra, see in the figure below in the case of two InSpectra modules.
You can display or hide the parameter columns via the context menu (right mouse click in the heading).
In every parameter column, the displayed values can be sorted by clicking on the table header. A triangle in the header indicates whether the sorting direction is ascending or descending. The order is automatically re-sorted if the order changes during acquisition.
You define the preference for sorting in the properties dialog of the FFT view in the node Spectrum table, see chapter Spectrum graph and spectrum table. The figure below shows a data table sorted by peak values.
Show bands / enable collapsed bands
Use this option to globally decide for all bands whether these are displayed in the spectrum graph and whether they can be shown as collapsed bands.
If the option Show bands is enabled, the display of individual bands in the Visible column can be determined separately.
If the option Enable collapsed bands is marked, the display of the individual bands in the Collapsed column can be determined separately. Collapsed bands are indicated by a triangle at the center frequency.


