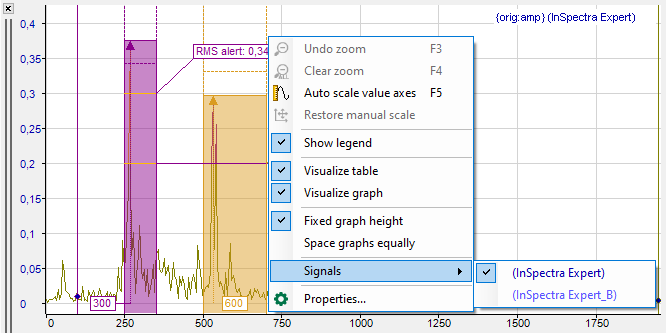
The graphical display of the frequency spectrum always shows the last result of the FFT in two-dimensional appearance or the spectrum selected in the waterfall or contour plot. (The selected spectrum in the waterfall view is shown with a different color, marked in the contour plot with a triangle):
-
Spectrum
-
Frequency bands
-
Value bands
-
InSpectra bands
-
Characteristic values of the InSpectra bands
-
Limits of the InSpectra bands
In the figure above the display shows three different frequency bands and at least a part of the spectral graphs from the main window. You can add additional graphs by dragging and dropping them from the main window or from the signal tree via drag & drop. The displays are linked so that all graphs in the small spectral display can also be seen in the main window.
When zooming in, more details can be seen.
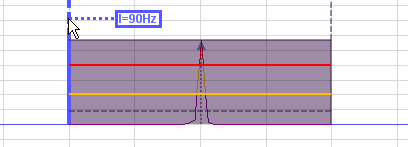
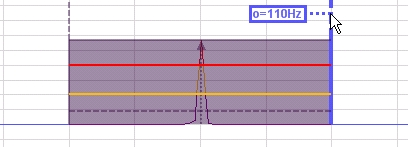
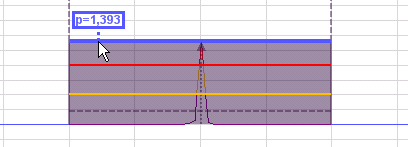
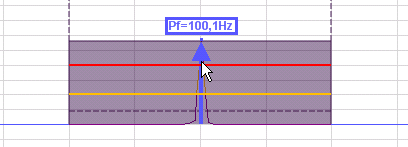
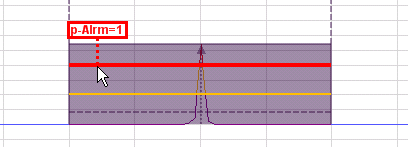
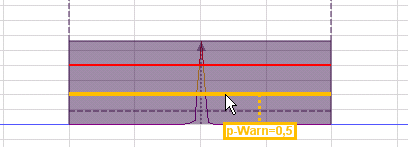
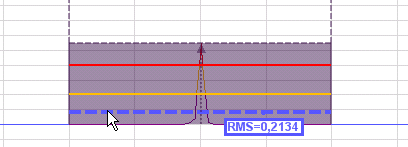
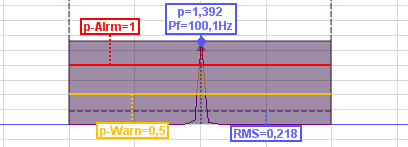
The most important parameters of the frequency bands and of the spectrum are shown with dotted and colored lines. You are shown the respective values when you position the cursor on the lines (hovering).
Limit curves can also be displayed for Auto Adapting modules. If “Warning and alarm” is used as the event mode in the profile, the warning limit is displayed in yellow and the alarm limit in red.
If “Lower and upper” is used as the event mode, the lower limit is displayed in blue and the upper limit in green.
Information in the spectrum graph:
|
Lower cutoff frequency |
Upper cutoff frequency |
|
Peak (peak amplitude) |
Peak frequency |
|
Alarm limit |
Warning limit |
|
RMS |
Display of all descriptors by selection in the spectrum properties |
Note |
|
|---|---|
|
If limit values and reference values are not displayed, you can activate the Show events/references on dynamic auto scale option in the Value axis node. The scaling is then automatically adjusted so that events and reference values are displayed. |
|
The configuration of the bands is described in chapter Bands.
You can decide in the spectrum properties (by using the context menu of the display) which markings and parameters are to be displayed (permanently) and whether the graph should change the color when exceeding the alarm limits.
If there are several spectra in the display, individual display properties can be assigned to every spectrum.
If the spectrum graph has the focus (after a mouse click on the header bar), the tool buttons for zooming out and restoring the manual scale relate to this graph and not to the main window. The same applies to the assigned function keys <F3>, <F4> and <F5>.
Base axis
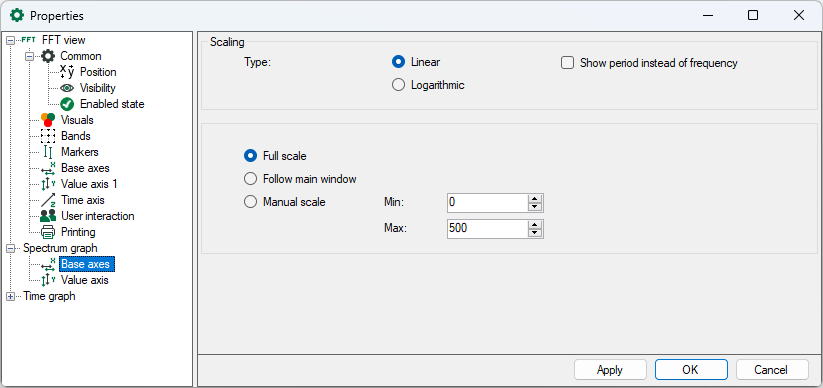
The display has a base axis corresponding to that of the main window. You can still modify the settings of the base axis in the display properties, for example, to select a logarithmic division instead of a linear division or to provide manual scaling. In addition, you can display the period instead of the frequency.
If Cepstrum is selected as the spectrum method in the InSpectra profile, the result of a Millstrum analysis can be displayed.
For information on millstrum analysis, see .
You can choose to scale manually or display the full range.
If you zoom in the spectrum graph or in the main window, this is usually independent from each other. By using the "Follow main window" option, you can determine that a zoom action in the main window also affects the spectrum graph, but only in horizontal direction.
Value axis
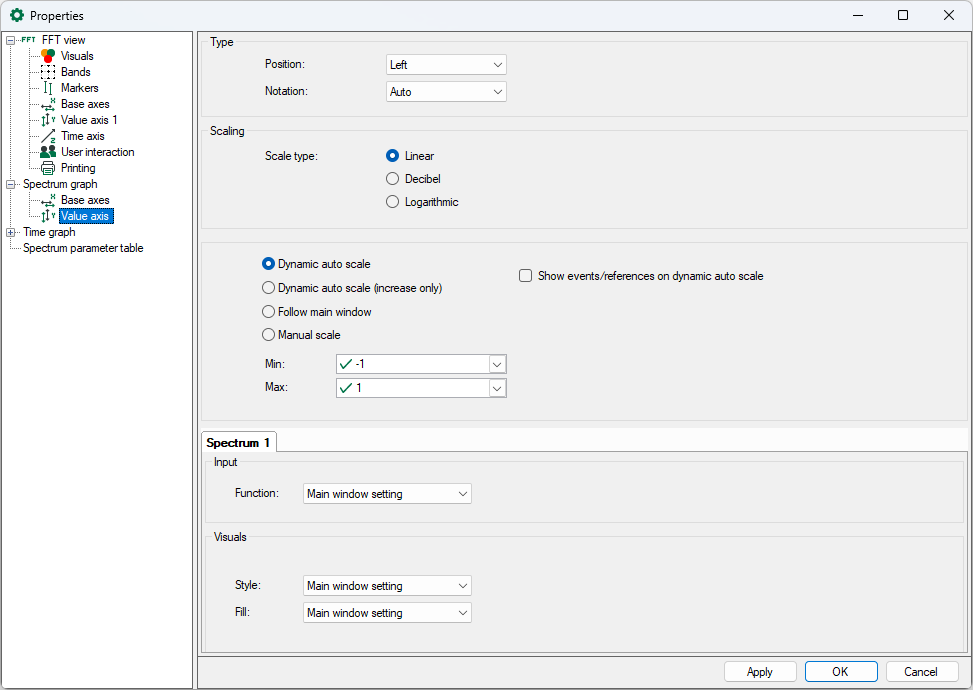
The spectrum graph has only one value axis. All charts in the display are displayed on the same scale of values. You can change the settings of the value axis in the properties of the display.
For scaling the value axis, you can choose between linear, decibel and logarithmic.
Scaling mode
The options of the value axis of the main view are available for selection, see chapter Value axes, and in addition:
-
Follow main window: With this option, a zoom action in the vertical direction in the main window also affects the spectrum graph.
-
Show events/references on dynamic auto scale: the scaling is automatically adjusted so that events (such as limit values) and reference values are always displayed.
Spectrum x
In the Spectrum x tab, you can determine the display properties for style and filling for each spectrum separately. You can adopt the main window setting or select individual settings from the respective drop-down menu.
You can also set the display properties for style and fill for each spectrum separately. You can apply the main setting of the window or select individual settings from the respective drop-down menu.


