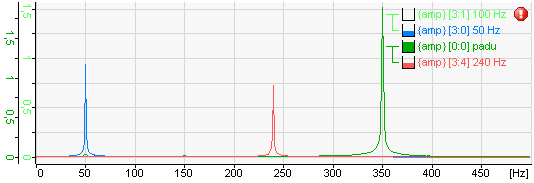
The legend indicates which signals are added to the view. The legend contains the following parts:
-
Tree structure of the value axis. This shows which spectra are shown on which axis.
-
Visual representation of the percentage buffer fill grade for each signal
-
Spectrum type (band or original spectrum, amplitude spectrum, power spectrum, cepstrum or power cepstrum)
-
Signal ID and signal name
-
Calculation mode
If a signal is invalid, this is indicated by an exclamation mark at the end of the signal row. The example below shows a legend with 4 signals in 2 groups with the first signal (100 Hz) being invalid.
The legend has a drag & drop function. This way, a spectrum can be laid upon different value axes. While dragging the spectrum, an arrow appears in the value axis tree pointing to the tree that will contain the spectrum when it is dropped. If a spectrum is not dropped inside a legend row, the spectrum will be laid upon a new axis.
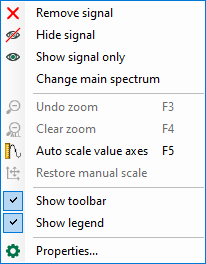
Right clicking in a legend row makes the context menu of the legend appear.
Clicking on “Remove signal” removes the corresponding signal. Clicking on “Hide signal” hides the signal and shows the signal name transparently. The signal is only temporarily hidden and can always be displayed again. By clicking on "Show signal only” in the context menu, only the selected spectrum remains in the display and all other spectra are hidden. Clicking on “Change main spectrum” makes the selected spectrum the main spectrum.
In the context menu under “Properties,” you can display the selected settings for the spectra.
In the properties of the FFT view (main window), you can also configure and enable a separate legend that contains additional information, such as name, comments and sampling time of the input signal, marker values or any literal text.

