In the Z-axis node you can define the display options for the waterfall view.
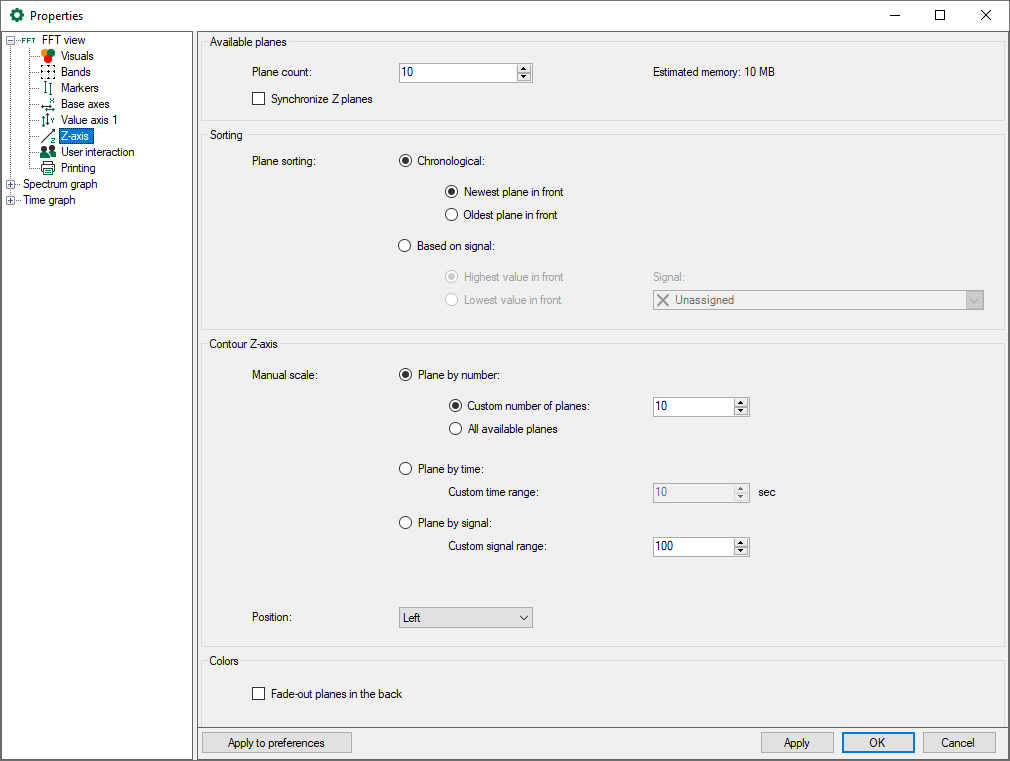
Available planes
-
Plane count Set the number of planes you wish to be displayed in the Z direction.
-
Synchronize Z planes (option in ibaPDA only) If you use multiple spectra in an FFT view, the spectra move forward at their own pace by default, depending on their sample rate or bin count. With this option you can synchronize the advance rates of the Z planes across multiple spectra. With this option enabled, the FFT view will not allow a spectrum to advance over the Z planes until all spectra have generated a new FFT result. While the view is waiting for certain spectra to generate results, the other spectra keep showing their newest results on the front plane.
-
Determine plane count automatically (option in ibaAnalyzer only) Number of spectra is detected automatically (max = 500).
Sorting
Here, you can select how the planes should be sorted:
-
When choosing the chronological plane sorting you can select whether the the newest (default) or oldest plane is in the foreground.
-
When choosing the sorting by a signal an average value of this process signal is calculated for each FFT. You can select whether the plane with the highest or lowest value should be in front. The sorting happens on the fly: Each time a new FFT comes in, all the planes are sorted again. This applies to the contour plot and the waterfall. You can select the desired signal in the field nearby.
Contour Z-axis
Specify here the distance at which the planes are to be arranged:
-
Plane by number The distance between the planes in the contour view is fixed. You can choose between a manually defined number of planes or display all available planes.
-
Plane by time A new plane is displayed after a defined time. The distance corresponds to the time difference between the planes.
-
Plane by signal This option can only be used if the plane sorting is Based on signal. The distance between the planes depends on the value of the process signal. The Custom signal range is the default range displayed in the contour plot. In the context menu of the time axis, there is an option Auto scale to scale the time axis so that all planes of that moment are shown.
Position
Specify the position (left or right) of the Z-axis.