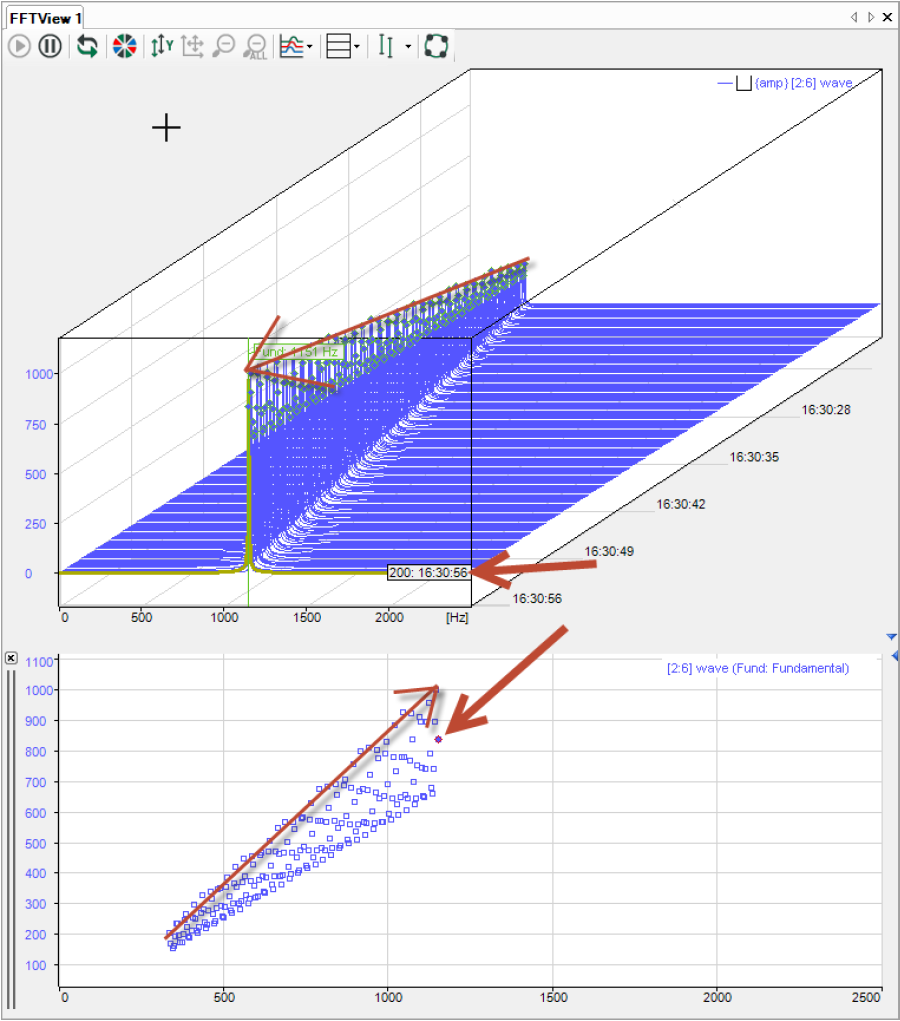
The marker spectrum display is used to represent the relationship between a dynamic marker (horizontal axis in Hz) and the associated spectrum value (vertical axis).
For each plane of the waterfall view, a point for the value pair is entered in the graph.
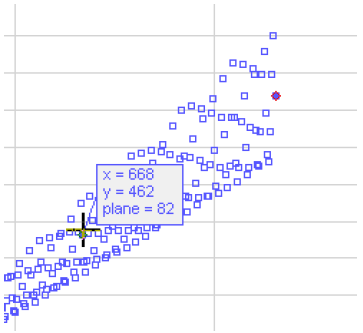
This display does not have its own interactive marker. When you hold down the <M> key, the mouse moves over the points and the corresponding values (X, Y, and plane) are displayed in a pop-up.
The point within the currently selected plane is highlighted with a red circle.
You can add multiple marker spectrum displays and configure them differently.