In the HD time periods table toolbar, you can filter the rows displayed by particular criteria. Enter a value or configure a query by clicking on the icon. If you remove a value, the filter is deleted.
To configure time period queries, open the query drop-down menu and click on the <Edit queries> button.

Note |
|
|---|---|
|
The event queries are stored on the ibaHD server. This means that the queries are available to all ibaHD clients (ibaPDA, ibaAnalyzer) if they are connected to the ibaHD-Server. |
|
Note |
|
|---|---|
|
The event queries are saved on the ibaHD-Server or locally, depending on the configuration. |
|
Configuring queries
All existing queries are shown in the query tree. You can arrange queries by using a directory structure.
|
Adds a new folder at the selected position |
|
|
Adds a new query at the selected position |
|
|
Deletes the selected node and any secondary nodes |
There are two types of queries:
-
Server queries are saved on the ibaHD-Server, which means that all connected clients can use the same server queries. Note: Only users who have the right Edit ibaHD queries can save or edit server queries.
-
Local queries are saved in the layout. Other connected clients cannot see these.
Local queries are saved in the query. Other connected clients cannot see these.
Query range
Every query is executed over a defined time range. There are several options for restricting the query range.
-
Unrestricted: The query covers the entire HD recording
-
Specify upon execution: After clicking on the start button for the query, a dialog appears in which you have to specify the query range
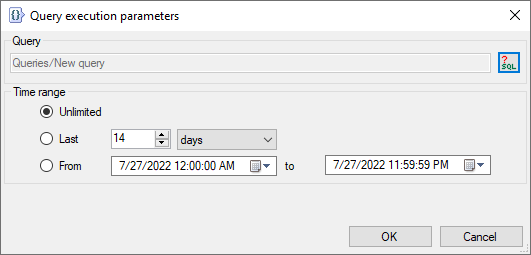
Clicking on <OK> executes the query.
-
The last xx minutes/hours/days/weeks/months: The query only covers a fixed period of time from the start of the query, e.g. the last 8 hours for a shift overview.
-
From Date to Date: The query covers the time range between the set days (inclusive).
Tip |
|
|---|---|
|
To set the current date, open the Date & Time Picker by clicking on the down arrow. Here, you can select the entry under Today….
|
|
Query details

Here, you create the actual query using notation similar to SQL.
The query begins with a SELECT statement.

Clicking on the green text opens the tree structure for the configured time periods. Select the time period you want to search for.

Click on the blue text to select a column in the table or any existing information fields.

Depending on the selected field (numeric or text field), clicking on the green equals symbol displays a list of operators. Select the required operator.
 |
 |
Behind the elements in the query, there are different buttons which you can use to extend or modify the query:
|
|
Deletes the expression |
|
|
Switches the right side of an expression between a fixed value and a field |
|
|
Adds a new expression to the instruction |
You can change the logical operator that is linked with a group of expressions by clicking on the operator.
 |
 |
Clicking on <OK> closes the editor and saves the created queries.
Executing the query
First select the relevant query from the list in the toolbar and then click on the button to the right.


When the query has been completed, the number of results found is displayed in the status bar on the right.


A query can return more results than the number of rows configured in the table. To display any other results, click on the blue "more…" link.
You can return to live mode by clicking on the ![]() button.
button.
With the ![]() button you can return to the display of the latest available time periods.
button you can return to the display of the latest available time periods.