In the tree of data stores, there is one Diagnostics node, which provides some information about the system load due to the data stores. The measurement must be running meanwhile.
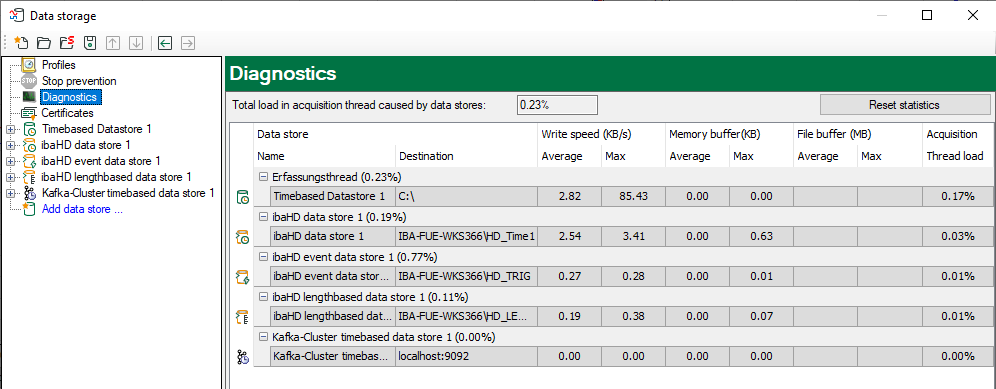
The performance values of all data stores are shown in the table. There is one row per data store. The rows are grouped according to the threads that write the data.
In each group row is the name of the thread and (in brackets) its share of the load. The load average is displayed by default. But, you can switch between the average and actual value using the context menu.
In the same menu, you can also adjust the display unit of the write speed.

In addition to the write speed, you will also see information on the occupancy of the main memory ("memory buffer") and the file memory ("file buffer"). Values in the "File buffer" columns only exist for HD data stores and for databases, cloud and MQTT data stores if the file buffer has been enabled for these data store types. For further information, please refer to the manuals for ibaHD-Server and the data stores (Data-Stores).
Depending on the data store type, the data displayed can be interpreted differently:
Normal time-based data stores with synchronous file access
The rows of this store type show the write speed of the data on the hard disk. The columns for the buffered data show zeros because the data are written directly on the disk. The column of the acquisition thread load shows the proportion of time needed for the run-length encoding and writing on the disk.
Time-based data stores with asynchronous file access
The rows of this store type show the write speed of the data on the hard disk. The columns for the buffered data show the amount of data that still has to be written on the disk. The column of the acquisition thread load shows the proportion of time needed for the run-length encoding. The actual writing process is carried out in the write thread, the load of which you can see in the group row.
ibaQDR data storage
The rows of this type of store show the write speed of all the input coil files from all measuring locations. The write speed of product coils and input product coils is not displayed. The group rows of the QDR product thread show the load due to the generation of the product coil files. The columns for the buffered data show the amount of length-based data that has not yet been used for a product coil file. The column of the acquisition thread load shows the share of the load due to saving time-based data in input coil files and generating length-based data at all measuring locations.
ibaHD data stores (time, length and event-based)
The rows of this store type show the write speed of the data on the ibaHD server. The columns for the buffered data show the amount of data that still has to be written onto the ibaHD server. These values should usually be close to zero. If the connection to the ibaHD server is interrupted, these values increase rapidly. If the file buffer has been activated for HD recording and the normal buffer is full, the data is stored in files on the hard disk ("file buffer").
The column of the acquisition thread load shows the proportion of time needed to provide the data to be written on the ibaHD server. This period includes:
-
Run-length encoding for time-based stores
-
Event trigger calculation for event-based stores
-
Generating length-based data for length-based stores
DB/Cloud, MQTT and MindSphere data stores
For this storage type, the rows show the write speed of the data to a DB or cloud server or an MQTT broker. The columns for the buffered data show the amount of data that still needs to be written to the disk. These values should usually be close to zero. If the connection to the target server or broker is interrupted, these values increase rapidly. If the file buffer has been activated for HD recording and the normal buffer is full, the data is stored in files on the hard disk ("file buffer").
The column for the acquisition thread load shows the proportion of time needed for the evaluation of the triggers and generation of the row data.
At the top, above the table, the total load of the acquisition thread due to the data store is displayed. This is the sum of all the values in the Acquisition thread load column. It is a measure of how much time is needed to process the data which should be stored. If this value increases to 100%, alarm generation and client updates are suspended. If the value remains at 100% for a long time, the ibaPDA system becomes overloaded and acquisition is stopped when the driver buffer overflows.
Tip |
|
|---|---|
|
With the DataStoreInfo… functions in the expression builder, you can make the relevant diagnostic data available as virtual signals for each data storage type. You can then visualize and record these signals. |
|