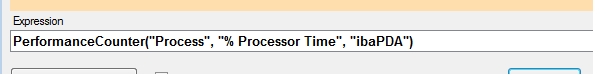
PerformanceCounter("'Category*'","'CounterName*'","'InstanceName*'")
Arguments
|
'Category*' |
Text entry from the "Object" column of the Windows Performance Monitor |
|
'CounterName*' |
Text entry from the "Performance Indicator" column of the Windows Performance Monitor |
|
'InstanceName*' |
Text entry from the "Instance" column of the Windows Performance Monitor |
Parameters ending with * are only evaluated once at the start of the acquisition.
Description
The PerformanceCounter function can read, display and record the progress of certain performance characteristics of the computer. It returns the value of the performance counter or 0 if the performance counter does not exist. With the PerformanceCounter function, one performance indicator can be read in each case. If you want to display multiple performance indicators, then you have to configure the function repeatedly.
Example
Monitoring system performance
Solution
In order to select the performance characteristics that should be monitored under Windows 7, click on the Windows icon and search for Computer Management. Then on the left side under System – Performance – Monitoring tools you need to select the item Performance monitoring. You can add performance characteristics to be monitored with the green +- symbol in the top bar.
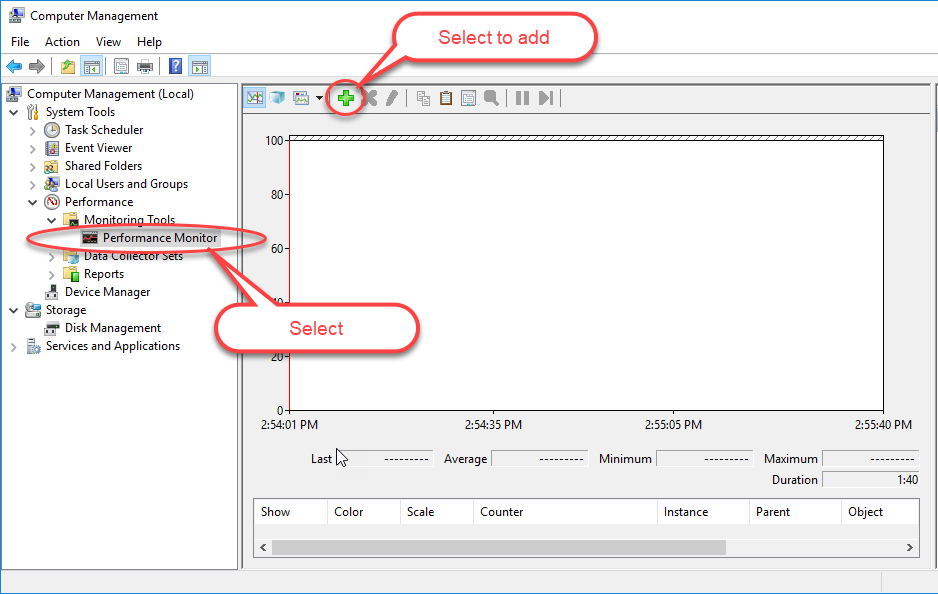
Fig. Show new performance characteristics to be monitored
Select the performance indicators and then the instances. In this case, process, ibaPDA, and all instances are selected, then added and confirmed with <OK>. In the following illustration, the steps are marked and numbered.
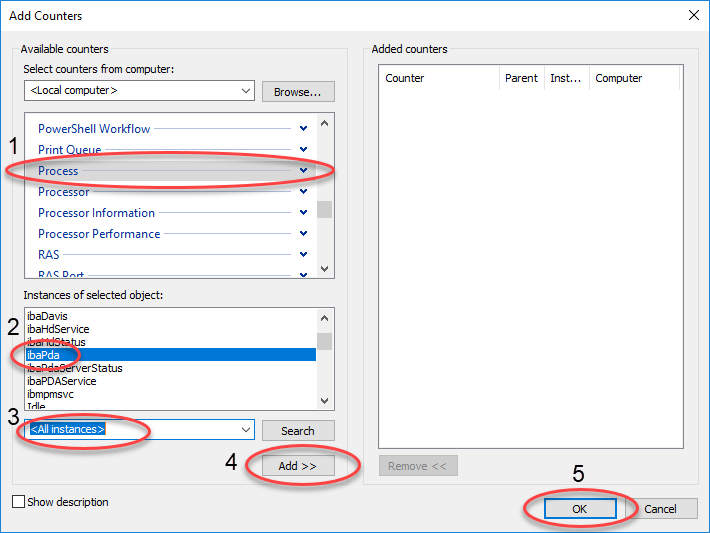
Fig. Selecting the function arguments
The allocation to individual function arguments by PerformanceCounter is illustrated in the next illustration. You must accurately enter the names of the individual performance indicators, objects and instances for the entry in ibaPDA.
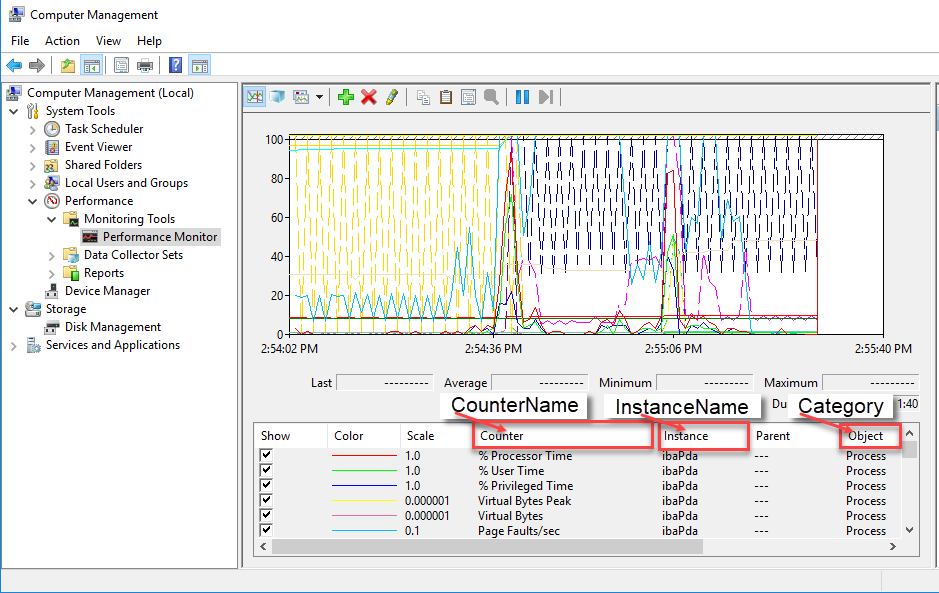
Fig. Name of the function arguments
Example for the entry in ibaPDA for determining the processor time: