MAvg('Expression','WindowInterval',' UpdateInterval=timebase',' Reset=0')
Arguments
|
'Expression' |
Measured value, for which the average value is formed |
|
|
'WindowInterval' |
Specification in seconds of the length of the interval over which the average is formed; must be a multiple of 'UpdateInterval'. |
|
|
'UpdateInterval' |
Optional parameter (default = time base); specifies in which cycle the calculation is performed. |
|
|
'Reset' |
Optional parameter (default = 0) to stop and restart the calculation. |
|
|
'Reset'=0 |
Perform calculation |
|
|
'Reset'=1 |
Stop calculation and set result to 0 |
|
|
'Reset'=2 |
Stop calculation and keep result |
|
Description
This function returns its result as the floating arithmetic mean value of 'Expression' calculated over a ' WindowInterval' in seconds. The calculation is performed in the 'UpdateInterval' cycle. 'UpdateInterval' is an optional parameter and is expressed in seconds. If 'UpdateInterval' is not specified then it is set equal to the time base (default), i.e. as small as possible. The calculation is then carried out progressively by one sample in each case. The calculation can be carried out in larger intervals if a (multiple) value of the time base is entered for 'UpdateInterval'.
'WindowInterval' determines the period for which the mean is calculated each time. 'WindowInterval' must be a multiple of 'UpdateInterval'. Otherwise, 'WindowInterval' is automatically changed to the first multiple of 'UpdateInterval' greater than or equal to 'WindowInterval.'
Tip |
|
|---|---|
|
Using these functions, signals and expressions that are not time-based, i.e. which have the basis length, frequency or 1/length, can also be processed. Instead of seconds, the X-axis range should then be entered in m, Hz or 1/m corresponding to the base. |
|
Example
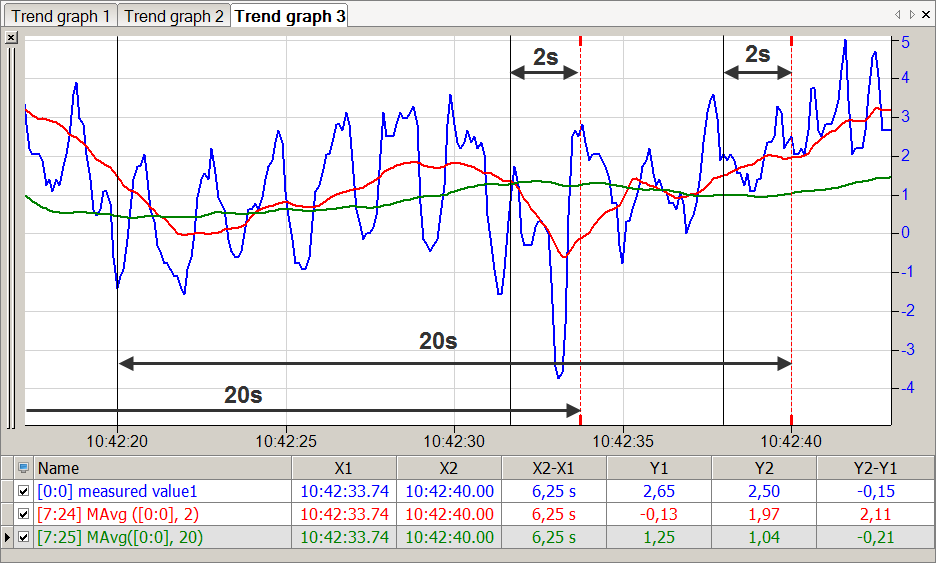
The mean values of the previous 2 and 20 seconds are relevant for a measured value.
Task description
The MAvg function is used once with an interval time of 2 seconds and once with an interval time of 20 seconds.
Solution
In the figure below the blue curve shows the measured value, the red curve shows the average over an interval of 2 seconds, and the green curve shows the average over an interval of 20 seconds