A temperature scanner with 12 measuring zones detects the temperature profile of a web-shaped product. The scanner supplies 12 analog signals, which form the vector VectorDemoSmall in the Groups section of the I/O Manager.
Module configuration
For this example one signal has been configured for each calculation function, e.g. Vector_Min for minimum, Vector_Avg for average.
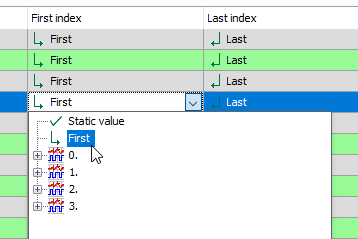
The vector VectorDemoSmall is selected in the Vector column for each signal.
First index = First and Last index = Last for including all 12 measuring zones in the calculation. The setting First index = 0 and Last index = 11 would lead to the same result, in this example.
If you only want to consider the zones around the center, e.g. because the lateral zones often deliver invalid values, you may enter 2 and 9.
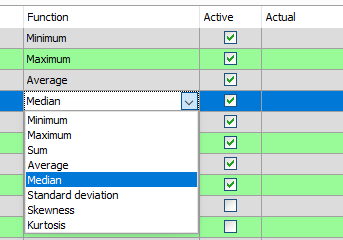
Selecting the calculation function for each signal.
Result
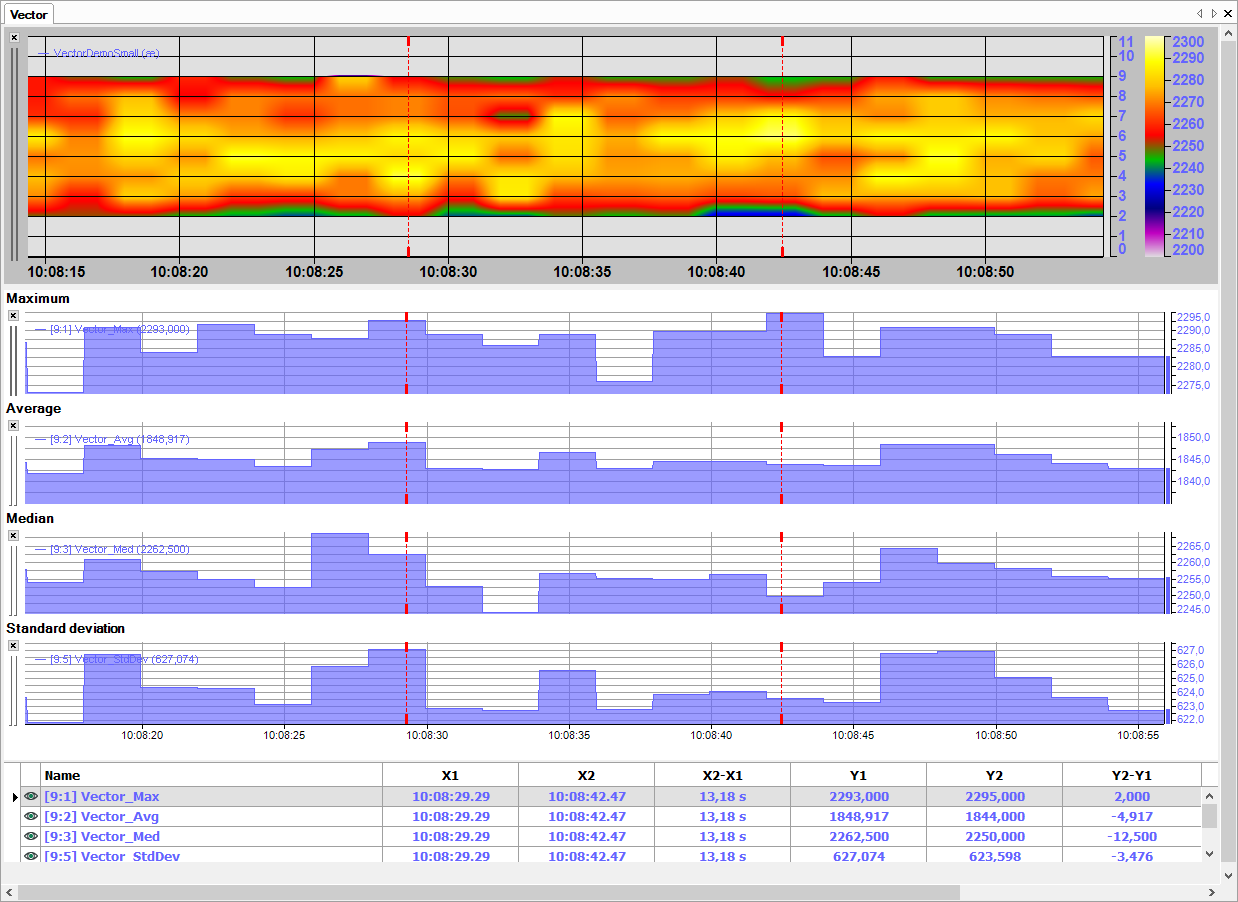
The following figure shows in the upper part the trend chart of the temperature scanner in 2D false color representation. The Y-axis shows the values 0 to 11, corresponding to the 12 temperature measuring zones. The temperature values are represented by the colors. For a better display the color scale is adapted to the temperature range from approx. 2200 °C to 2300 °C.
Below, there are four trend graphs showing the calculated values of the vector calculation module for maximum, average, median and standard deviation. The block-shaped trend graphs result from an acquisition timebase of 1 second for the temperature values.


