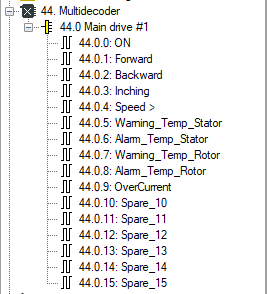
The signal tree shows the Multidecoder module as a main node. One level below, there are the decoders and one level further down the digital signals of the decoders.
The following figure shows the Multidecoder module of our example (drive status).
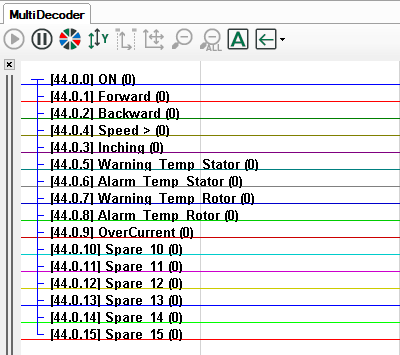
You can drag and drop the signals into a trend graph.
You can also drag and drop a complete decoder into a trend graph. If you
simply drag a decoder into a trend graph, then each signal will get its own signal strip.
If you press <Shift> at the same time, then all digital signals of the decoder will be shown in the same signal strip.

