All Ethernet-based interfaces offer a table in the I/O Manager that shows the status of each connection. Each line represents one connection.
The columns contain different values and information depending on the type of interface. The possible options and buttons above the table are also interface-specific.
Typically, the target systems connected are identified in the first column (left) by its name or its IP address.
The table shows the cycle times and error counters of the individual connections during data acquisition. Click the <Reset counter> button to reset the error counter and the calculation of the response times.
Additional information is provided by the background color of the table rows:
|
Color |
Meaning |
|---|---|
|
Green |
The connection is OK and the data are read. |
|
Orange |
The connection is OK, however the data update is slower than the configured update time. |
|
Red |
The connection has failed or been interrupted. |
|
Gray |
No connection configured. |
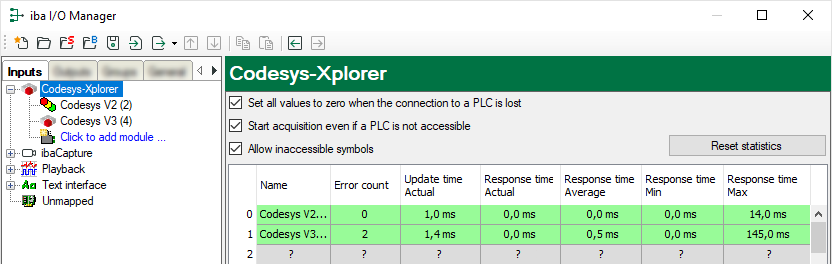
The figure below shows the connection table of the Codesys-Xplorer interface as an example.